pprof 是 Go 官方内置的性能分析工具,用于采集并分析 Go 程序的运行时性能数据,帮助开发者发现 CPU 瓶颈、内存泄漏、阻塞等待等问题。具体来说,支持 CPU、Memory、Block、Goroutine、Heap Profiling 等。
首先,应用程序通过 import _ "net/http/pprof" 匿名导入 pprof 包,用于在程序中进行插桩,然后通过下面的代码在对应端口启动 pprof 服务:
go func() {
    http.ListenAndServe("localhost:6060", nil)
}()
接下来,就可以通过浏览器访问 http://127.0.0.1:6060/debug/pprof/,可以看到如下界面:
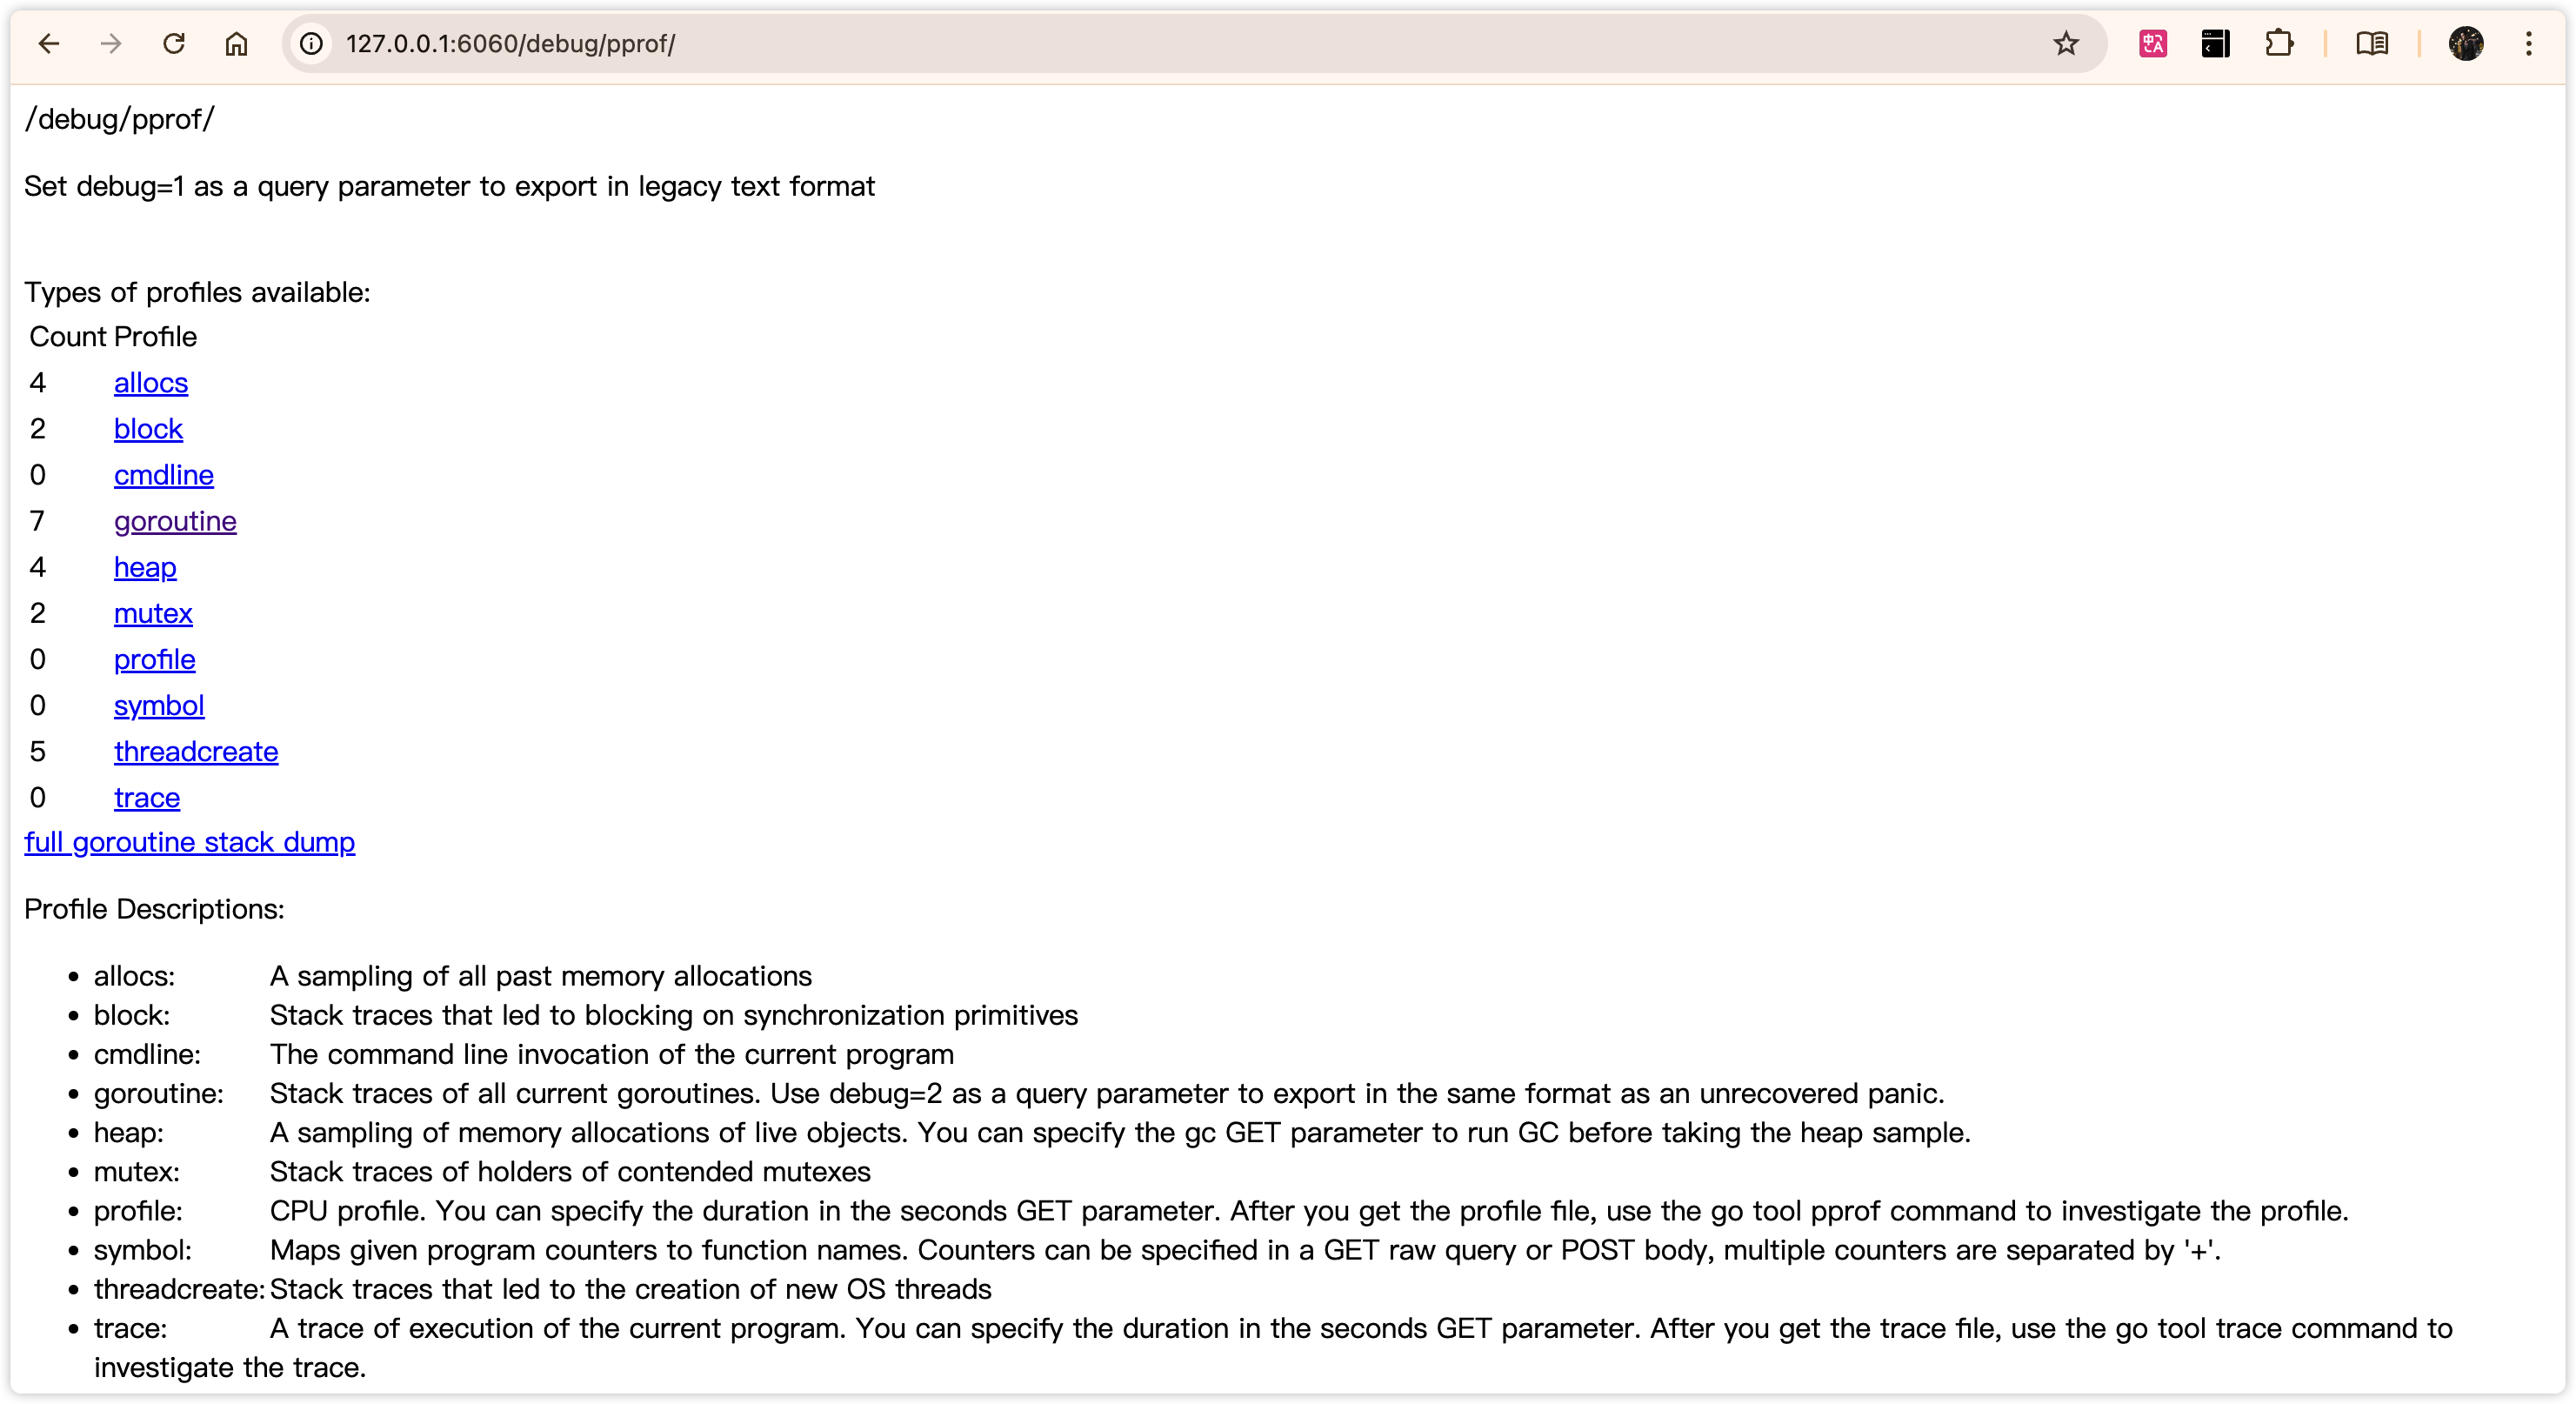
| 类型 | 描述 |
|---|---|
| allocs | 内存分配情况的采样信息 |
| blocks | 阻塞操作情况的采样信息 |
| cmdline | 显示程序启动命令及参数 |
| goroutine | 当前所有协程的堆栈信息 |
| heap | 堆上内存使用情况的采样信息 |
| mutex | 锁争用情况的采样信息 |
| profile | CPU 占用情况的采样信息 |
| threadcreate | 系统线程创建情况的采样信息 |
| trace | 程序运行跟踪信息 |
由于直接看网页不够直观,可以借助 go tool pprof 工具来排查。
1 CPU 调优
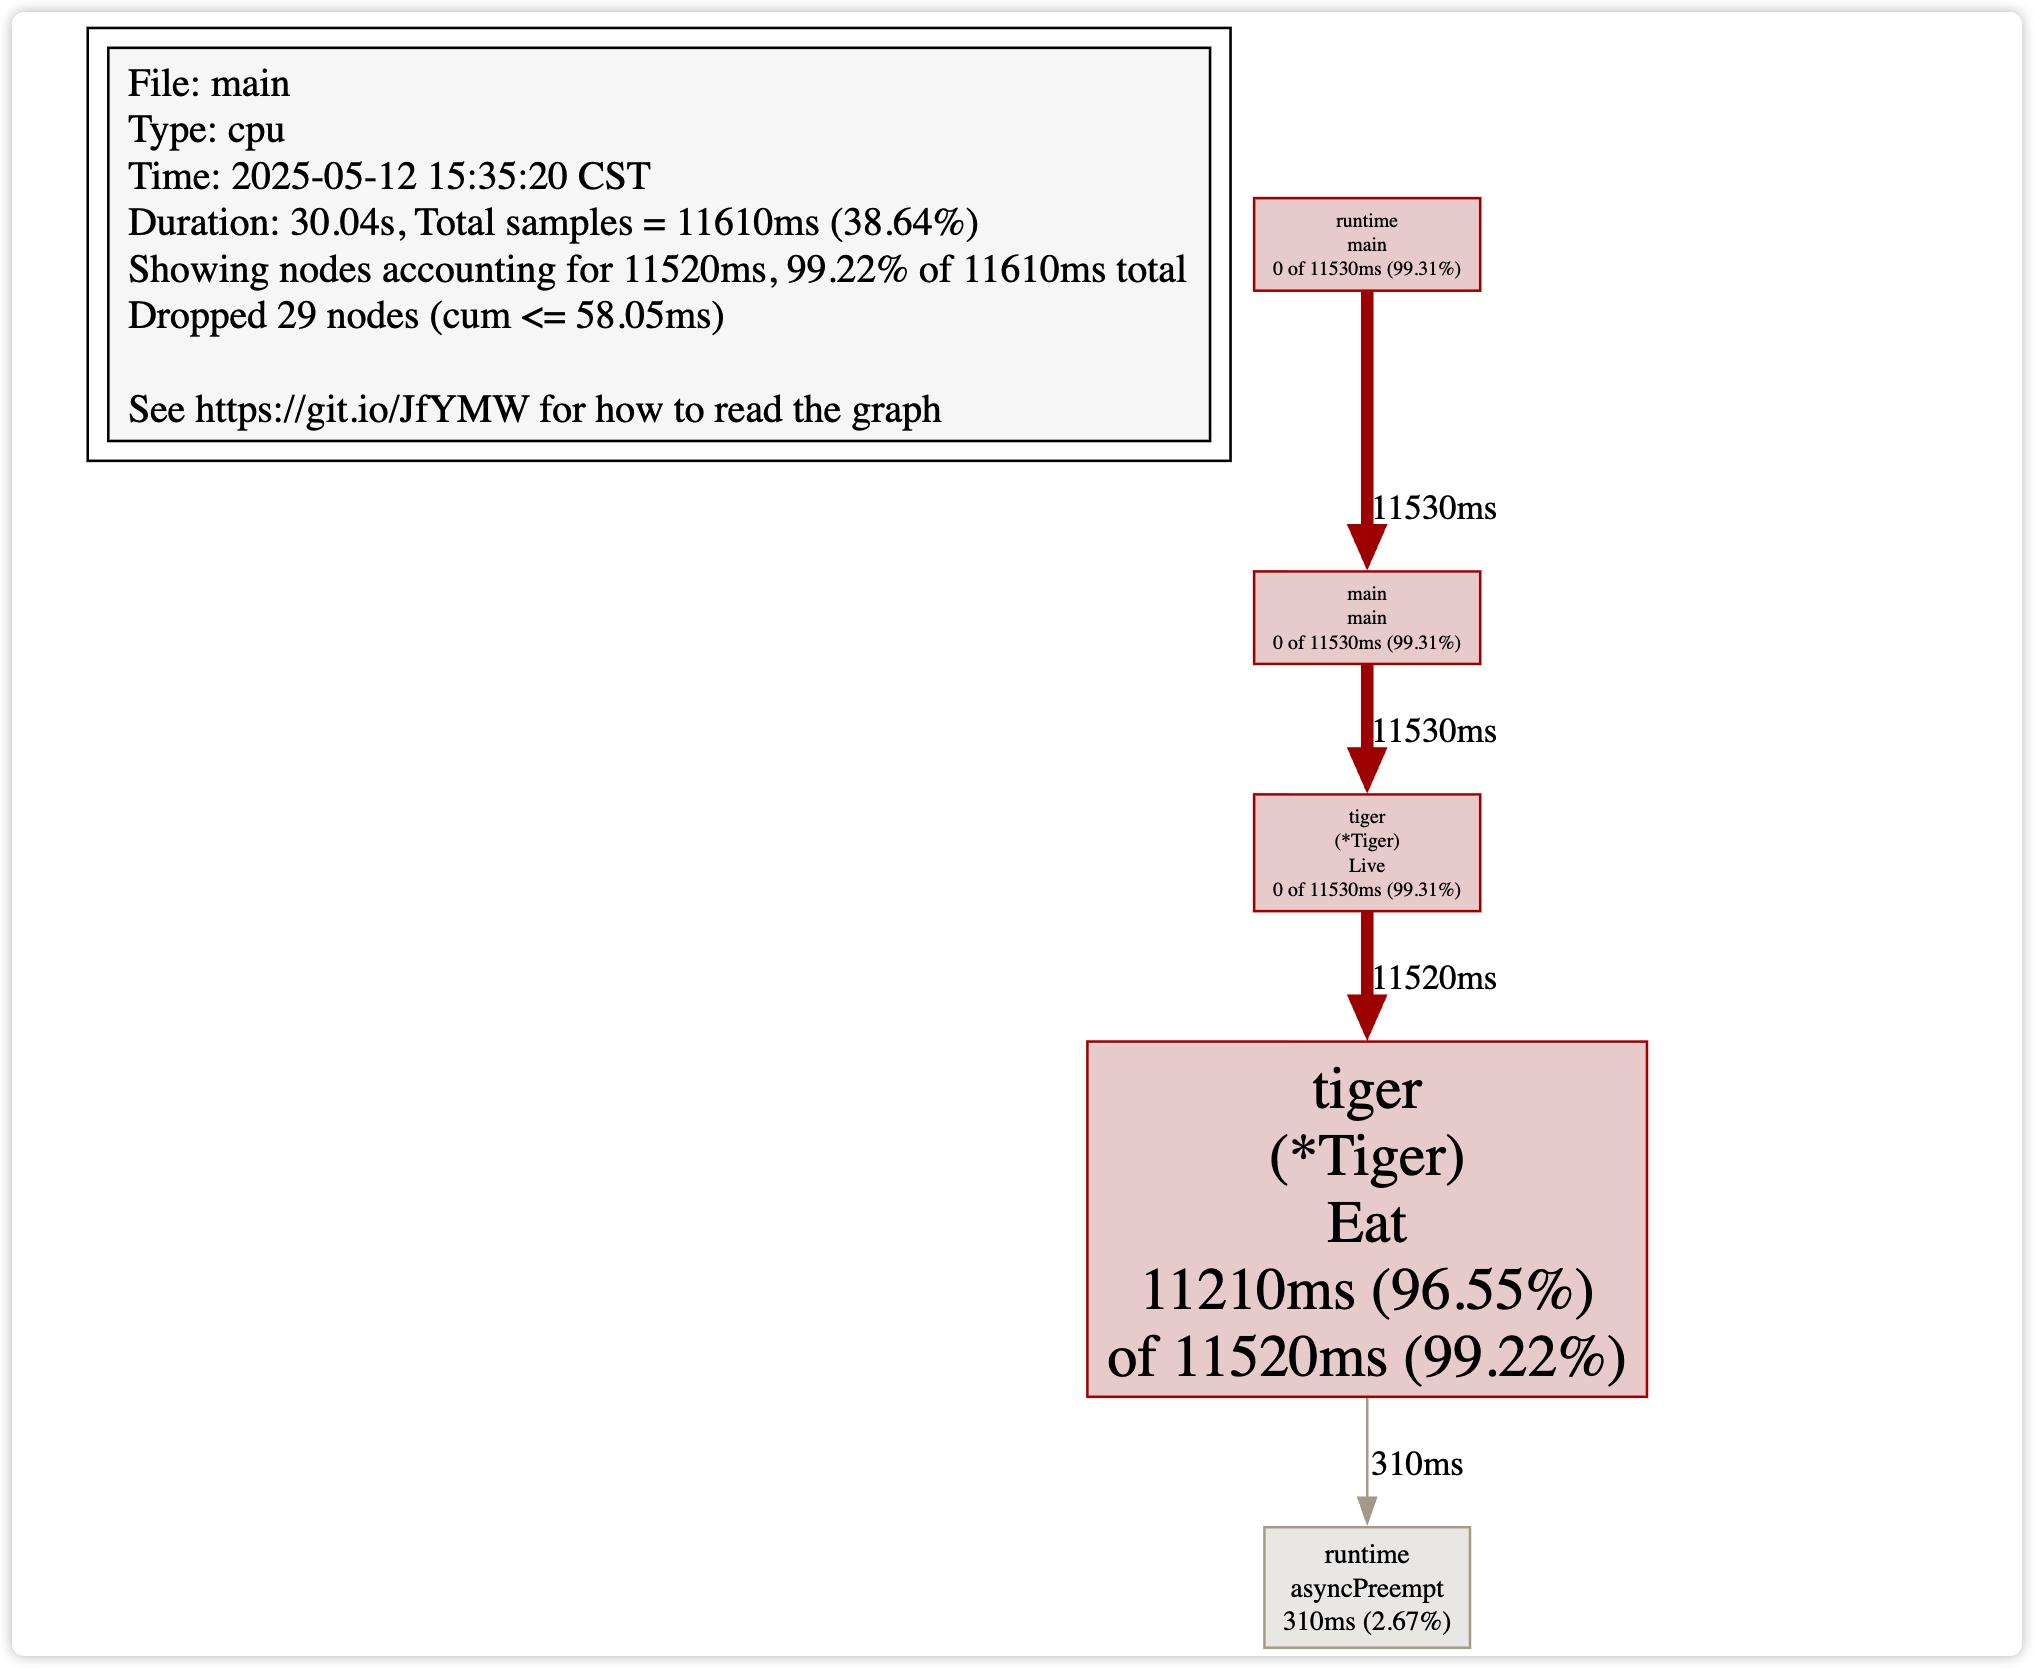
通过 go tool pprof "http://localhost:6060/debug/pprof/profile?seconds=30" 获取近 30 秒的执行记录,然后会进入到一个命令行交互界面,我们可以通过 top 命令查看 CPU 资源使用量的排序,通过 list xxx 查看相关代码段的实现,通过 web 命令生成一个可视化的界面。
(pprof) top
Showing nodes accounting for 11520ms, 99.22% of 11610ms total
Dropped 29 nodes (cum <= 58.05ms)
      flat  flat%   sum%        cum   cum%
   11210ms 96.55% 96.55%    11520ms 99.22%  github.com/wolfogre/go-pprof-practice/animal/felidae/tiger.(*Tiger).Eat
     310ms  2.67% 99.22%      310ms  2.67%  runtime.asyncPreempt
         0     0% 99.22%    11530ms 99.31%  github.com/wolfogre/go-pprof-practice/animal/felidae/tiger.(*Tiger).Live
         0     0% 99.22%    11530ms 99.31%  main.main
         0     0% 99.22%    11530ms 99.31%  runtime.main
(pprof) list Eat
Total: 11.61s
ROUTINE ======================== github.com/wolfogre/go-pprof-practice/animal/felidae/tiger.(*Tiger).Eat in /Users/harrick/CodeField/Golang/go-pprof-practice/animal/felidae/tiger/tiger.go
    11.21s     11.52s (flat, cum) 99.22% of Total
         .          .     21:func (t *Tiger) Eat() {
         .          .     22:	log.Println(t.Name(), "eat")
         .          .     23:	loop := 10000000000
    11.21s     11.52s     24:	for i := 0; i < loop; i++ {
         .          .     25:		// do nothing
         .          .     26:	}
         .          .     27:}
         .          .     28:
         .          .     29:func (t *Tiger) Drink() {
| 类型 | 描述 |
|---|---|
| flat | 当前函数本身的执行耗时 |
| flat% | flat 占 CPU 总时间的比例 |
| sum% | 上面每一行的 flat% 总和 |
| cum | 当前函数本身加上其周期函数的总耗时 |
| cum% | cum 占 CPU 总时间的比例 |
可以看到,就是 Tiger.Eat() 方法中,有一个很大的 for-loop,占用了绝大多数 CPU 时间。
此外,我们也可以用 web 命令来生成一个可视化界面,这需要提前安装 graphviz 工具,可以很直观的定位到 CPU 资源消耗较高的部分。
使用 go tool pprof -http=:8080 http://localhost:6060/debug/pprof/profile 效果更好,直接在网页上看 top、web、火焰图、函数列表、调用图等内容。
2 内存分析
同理,go tool pprof http://localhost:6060/debug/pprof/heap 命令,然后 top、list、web 命令一条龙,或者使用网页工具。
可以看到大概用了 1.2 GB 内存,而我们代码中只申请了 1 GB,这是因为扩容机制,在小于 1024 时,是两倍扩容,大于 1024 时,是 1.25 倍扩容,所以底层会使用 1.2GB 左右的内存。总之这个值会一直增大,增大到这个值,也有可能是会出现 1G+0.5G 这种情况,我觉得这种状态应该是 GC 问题,我们可以在代码里加上 runtime.GC() 来强制进行 GC。
3 排查 GC
使用命令 GODEBUG=gctrace=1 ./main | grep gc,效果如下:
GODEBUG=gctrace=1 ./go-pprof-practice | grep gc
gc 1 @0.002s 1%: 0.008+0.33+0.004 ms clock, 0.008+0.13/0.10/0+0.004 ms cpu, 16->16->0 MB, 16 MB goal, 0 MB stacks, 0 MB globals, 1 P
gc 2 @3.006s 0%: 0.070+3.4+0.010 ms clock, 0.070+0.10/0.39/0+0.010 ms cpu, 16->16->0 MB, 16 MB goal, 0 MB stacks, 0 MB globals, 1 P
gc 3 @6.014s 0%: 0.081+1.8+0.006 ms clock, 0.081+0.10/0.17/0+0.006 ms cpu, 16->16->0 MB, 16 MB goal, 0 MB stacks, 0 MB globals, 1 P
gc 4 @9.021s 0%: 0.040+1.1+0.003 ms clock, 0.040+0.070/0.14/0+0.003 ms cpu, 16->16->0 MB, 16 MB goal, 0 MB stacks, 0 MB globals, 1 P
gc 5 @12.026s 0%: 0.075+1.3+0.007 ms clock, 0.075+0.14/0.36/0+0.007 ms cpu, 16->16->0 MB, 16 MB goal, 0 MB stacks, 0 MB globals, 1 P
gc 6 @15.030s 0%: 0.038+0.87+0.002 ms clock, 0.038+0.061/0.14/0+0.002 ms cpu, 16->16->0 MB, 16 MB goal, 0 MB stacks, 0 MB globals, 1 P
gc 7 @18.035s 0%: 0.055+0.98+0.002 ms clock, 0.055+0.057/0.14/0+0.002 ms cpu, 16->16->0 MB, 16 MB goal, 0 MB stacks, 0 MB globals, 1 P
可以看到,每隔 3s 就进行了一次 GC,说明 GC 频繁,此时我们可以去通过 go tool pprof http://localhost:6060/debug/pprof/alloc 来进行性能调优。
4 协程、阻塞、锁等问题
同理,top、list、web,或者直接使用网页来进行处理,原理基本上都是一样的。
5 Utils
每次进入交互式终端,都会提示 type ‘help’ for commands, ‘o’ for options,help 会告诉我们有哪些命令,差不多就是上面我们用到的一些,而 o 中有一个选项是 sample_index,这个选项有这几种类似
- alloc_objects:程序累计分配过的对象数量;
- alloc_space:程序累计分配的总字节数;
- inuse_objects:当前仍在使用中的对象数量(未被回收);
- inuse_space:当前仍在使用中的字节总量,默认值。
(pprof) o sample_index=alloc_space // 累计分配
(pprof) top
[!NOTE] Linux 系统性能调优命令
- top:-p pid -d 秒,用于只监视指定进程并指定刷新时间,可以看到 CPU、内存等占比;
- ps aux:显示所有进程信息,-o 自定义显示字段,可以看到 stat 进程状态(R、S、Z);
- vmstat 1 5:可以看到可运行进程数、内存情况(swap、free、cache)、CPU(用户、内核)。
6 原理剖析
import (
    "log"
    "net/http"
    // 启用 pprof 性能分析
    _ "net/http/pprof"
    "runtime"
)

func main() {
    runtime.GOMAXPROCS(1)
    // 启用 mutex 性能分析,需要手动开启
    runtime.SetMutexProfileFraction(1)
    // 启用 block 性能分析,需要手动开启
    runtime.SetBlockProfileRate(1)
    gofunc() {
        // 启动 http server. 对应 pprof 的一系列 handler 也会挂载在该端口下
        if err := http.ListenAndServe(":6060", nil); err != nil {
            log.Fatal(err)
        }
        os.Exit(0)
    }()
注意到只需要匿名导入 pprof 包即可启用功能,之所以如此,是因为在 pprof 包下通过的初始化函数,向 net/http 的默认 server——DefaultServerMux 中完成了一系列路径及对应 handler 的注册。
func init() {
    // 目录页
    http.HandleFunc("/debug/pprof/", Index)
    // …
    // cpu profile 采样
    http.HandleFunc("/debug/pprof/profile", Profile)
    // …
}
Go 的性能分析功能在 runtime/pprof 和 runtime 包中实现,主要依赖以下机制进行:
6.1 CPU 分析
Go 在开启 CPU profiling 时会通过 setitimer 系统调用,定时向所有线程发送 SIGPROF 信号。每次线程收到信号,都会记录当前函数调用栈(stacktrace)。利用 runtime.Callers() 获取程序计数器 PC(Program Counter)链,再通过 runtime.FuncForPC() 映射成函数名。
6.2 Heap 分析
- Go runtime 在每次 分配内存 时,会按照概率采样一次(非每次分配都会记录)。
- 采样频率默认配置为每 512KB 总分配量采样一次。
- 所有采样数据保存在 memProfile 的全局结构中。
- 每次 GC 时,Go 会标记哪些对象已释放,并将这些信息也更新到 heap profile 中。
6.3 Block 分析
- 开启后,Go 会在 goroutine 因channel、select、sync 等操作阻塞时记录堆栈和阻塞时长。
- 被重新唤醒后,采样数据就会保存在 blockProfile(全局)中。
6.4 Mutex 分析
- 开启后,每次 sync.Mutex 加锁/解锁时,都会记录锁等待时间。
- 加锁耗时信息会在 Unlock() 时上报,记录进 mutexProfile。
go tool pprof 的核心功能:从指定地址下载分析数据并渲染报告。下载回来的是 gzip 压缩的 protobuf 数据文件(.pb.gz),里面包含函数名及栈结构、各采样点累计的 CPU 时间、采样次数。